Leveraging Revit Data with Kinship & Power BI

Last week we held a webinar for our enterprise customers on how to access their Kinship data in third-party tools like Microsoft's Power BI. This feature allows customers to build their own metrics, analytics and reporting on top of the data that Kinship captures about their Revit content, projects and team. The webinar was one of our most successful in terms of numbers and engagement, and perhaps it bears some explaining why.
Revit environments are like snowflakes.
One of the best things about Kinship (in our opinion) is the rich data it provides on a firm's overall Revit environment. There are plenty of tools out there that just focus on one piece of the Revit data ecosystem – content management, project management, model health, team activity, or IT analytics.
But the reality is that all of those pieces are interconnected. They all affect each other in terms of how a team works together in Revit and, ultimately, how they deliver their projects.
Think about questions like the following:
- Which content is being used the most in projects?
- Which kinds of projects run smoothly and which kinds tend to have issues?
- Why are certain users having lots of slow or failed syncs?
- Why does our standard content keep getting modified within projects?
- Why are we having so many crashes on that project this week?
These are important questions that routinely come up for any team working in Revit. Yet there's no easy way to answer them without connecting the dots between content, projects, team and IT.
That's the beauty of Kinship. We connect those dots to provide metrics and analytics that answer the key questions for managing and improving a firm's Revit practice.
At the same time, every firm is at least a little bit different when it comes to their Revit ecosystem. No two firms will look at their data in exactly the same way or with the exact same goals in mind. We try to provide features, information and analytics that will cover as many use cases as we can, but of course it's impossible to anticipate and meet every need.
Powerful data.
This is why giving firms easy access to the data behind their Kinship account is so powerful. It allows firms to leverage the Revit data they have in Kinship to answer the distinct questions and track the unique goals that we aren't able to cover or simply haven't gotten to yet.
On the webinar, we walked customers through the steps to access their data and build a first custom report in Power BI. We also highlighted some sample reports and dashboards that customers have built to do things like:
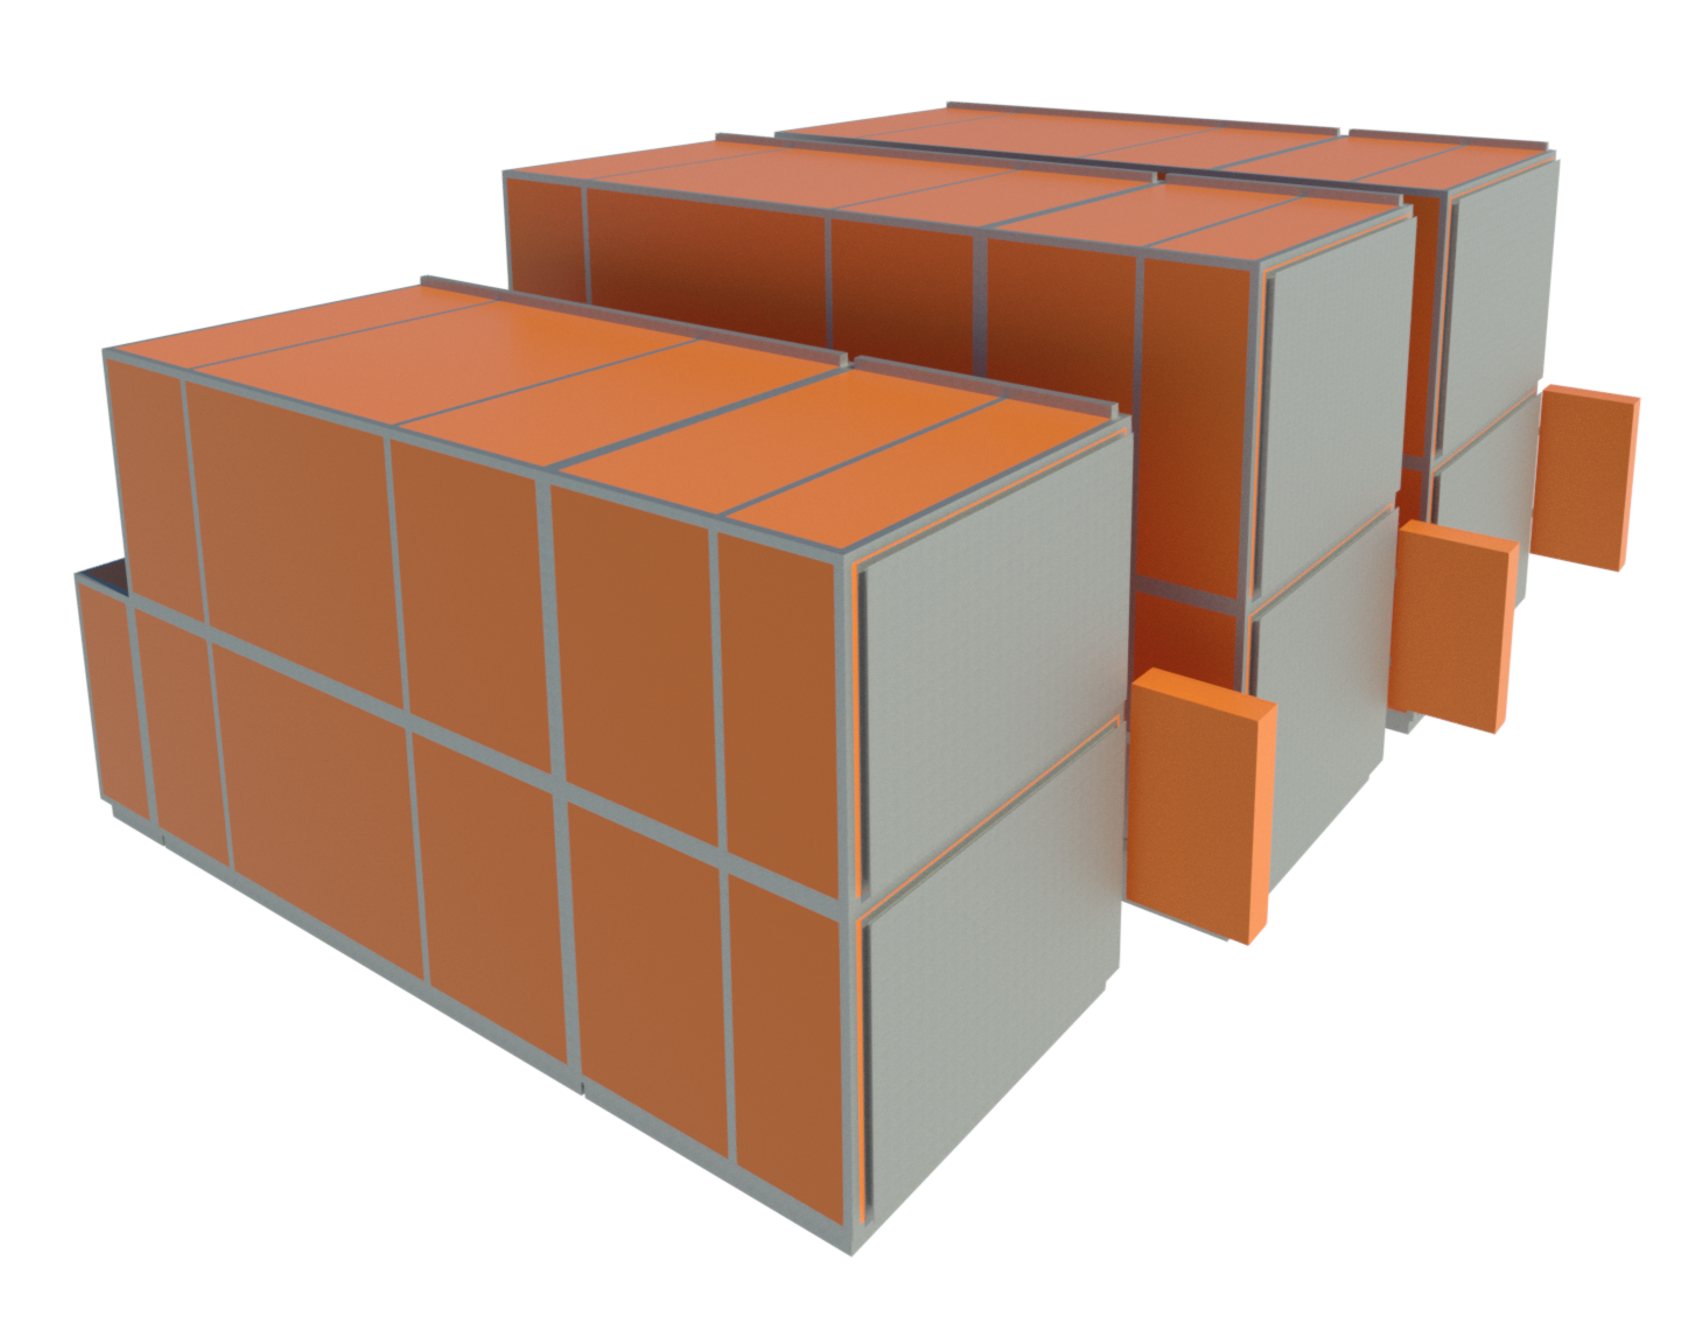
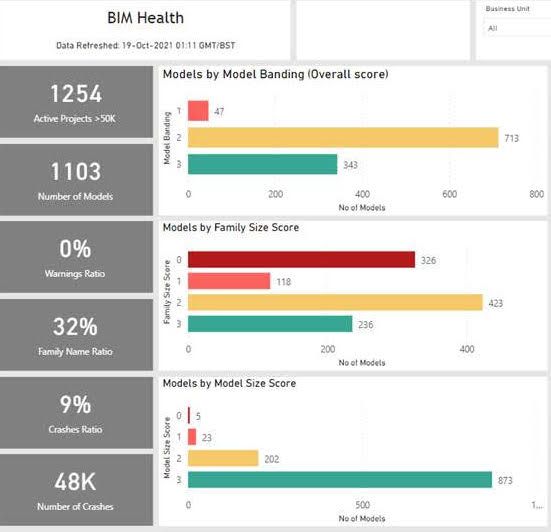
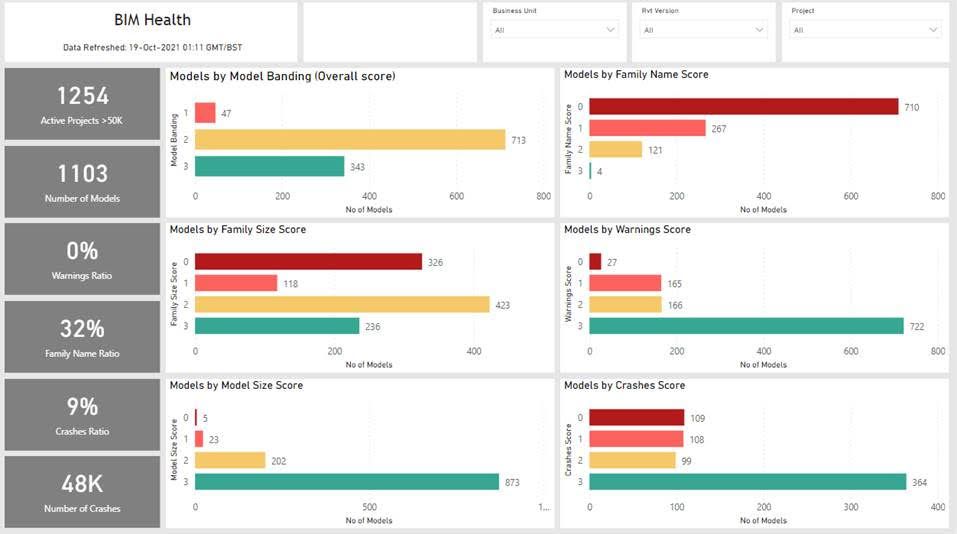
- Identify unhealthy Revit families according to multiple attributes like file size, warnings and naming.
- Assess Revit content needs by looking at usage statistics across categories and projects.
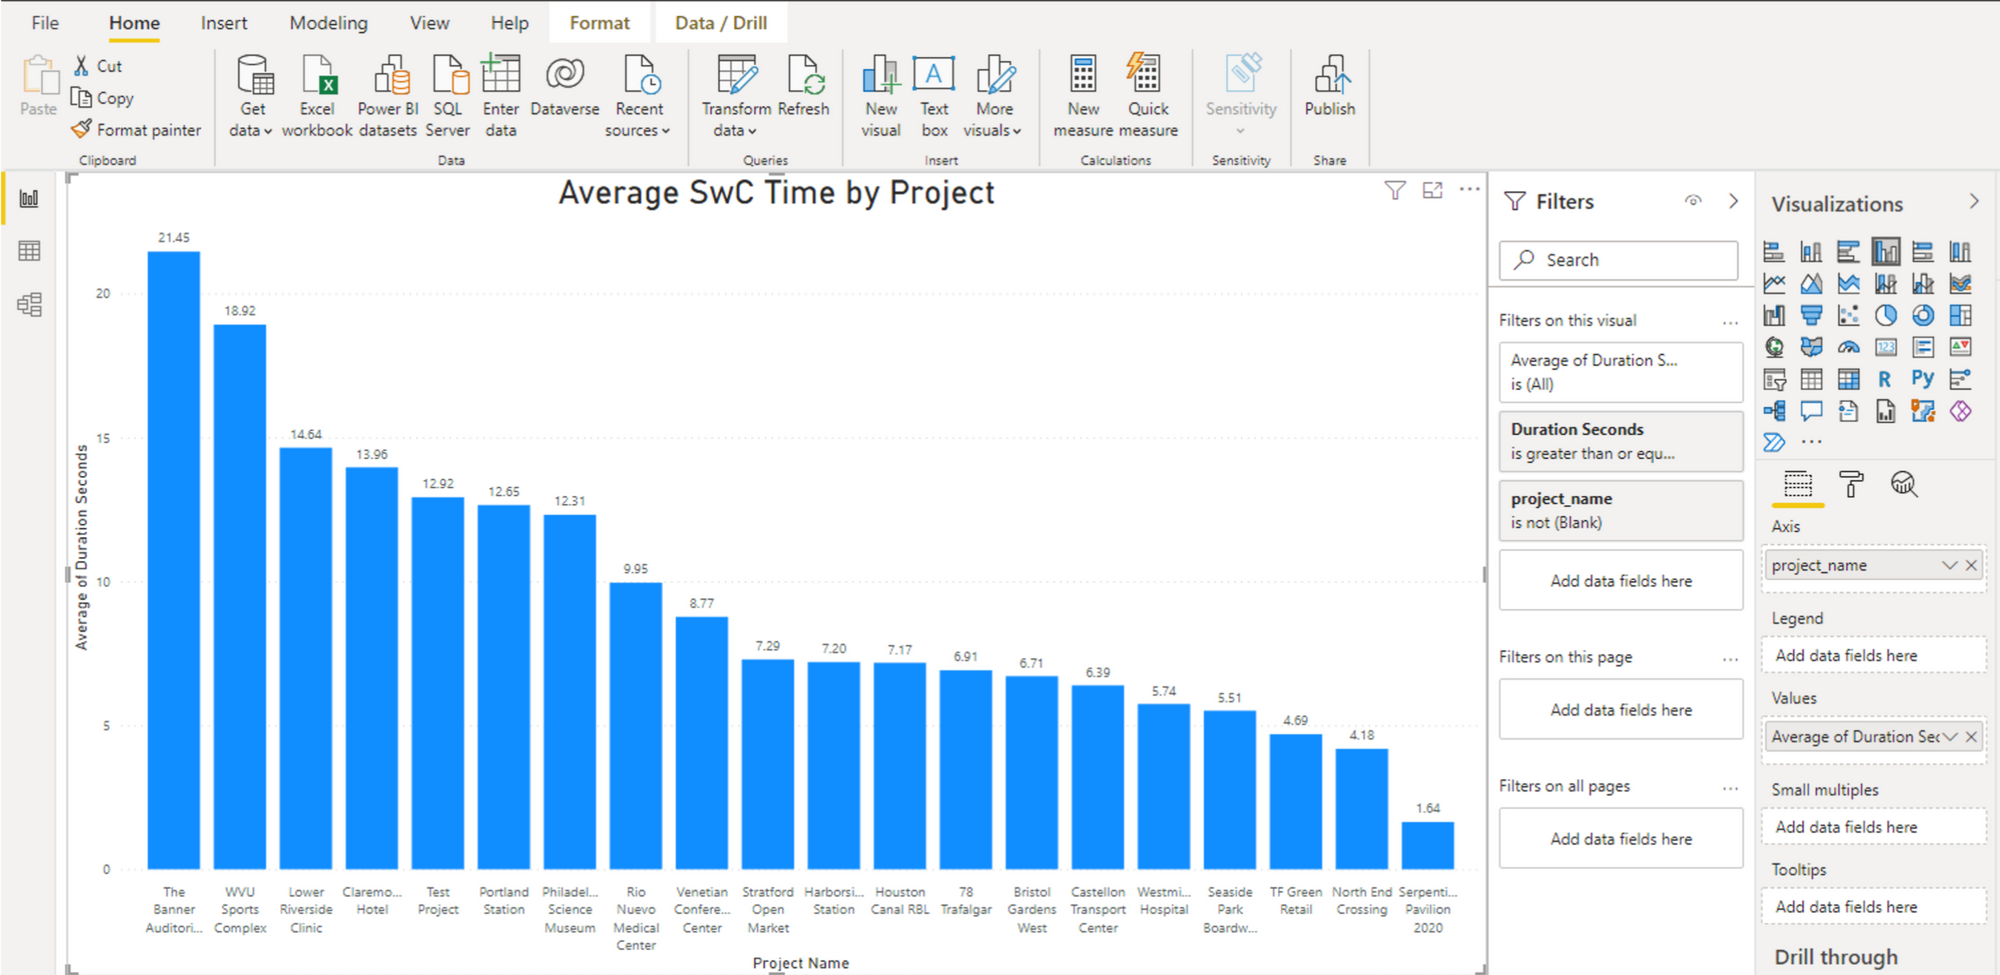
- Monitor project health according to a custom scoring system based on factors like file size, sync with central times and crashes.
- Track Revit usage across offices and teams and compare it with usage statistics for other related software (captured from a different piece of software and mixed together in Power BI).
Tools like Power BI can be incredibly powerful for getting more value out of the Revit data that normally goes un-captured and unseen without a tool like Kinship. Power BI and its peers are certainly not the most intuitive tools to use, but that's why hosting a webinar to provide guidance and support proved to be such a hit. We look forward to hosting further webinars on Power BI and diving deeper into how firms can leverage their Kinship data in new and unique ways to help them get the most out of Revit.